3. Why is a "normal" tangent graph uphill, but a normal cotangent graph downhill? Use unit circle ratios to explain.
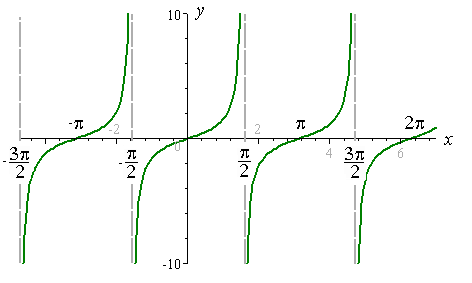
This image displays a "normal" tangent graph (uphill) ^
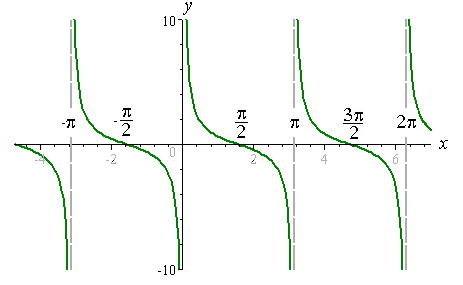
This image displays a "normal" cotangent graph (downhill) ^
The difference between these two graphs all depend on the ASTC (quadrant signs) & the position/placement of the asymptotes. The asymptotes are placed differently b/c of their ratios. The ratio of tangent is sine/cosine therefore we must place the asymptotes on where cosine = 0. Cosine equals zero at 90 degrees (pi/2) and 270 degrees (3pi/2). For cotangent, the ratio is cosine over sine so we must place the asymptotes on where sine = 0. That would be 180 degrees (pi) and 360 degrees (2pi). We also utilize the quadrant signs. We know that for tan/cot the ASTC signs are: + - + - . When the quadrant is positive, we graph above the x-axis. When the quadrant is negative, we graph below the x-axis. Now because the placements of the asymptotes are different for tangent & cotangent, it causes the direction of the graphs to become different.
Citations:
Images of the cot/tan graphs: http://www.intmath.com/trigonometric-graphs/4-graphs-tangent-cotangent-secant-cosecant.php

No comments:
Post a Comment